
About
João Santos is a Senior Data Engineer at Trimble, building the analytics platform behind autonomous procurement — Dagster orchestration, Glue/Athena on S3, and QuickSight at production scale.
Previously at Transporeon and Amazon (EU Supply Chain Analytics), he shipped data platforms end to end: legacy RDS migrations, pipeline observability, cost optimization, and self-service BI for hundreds of users.
Focus areas: data platform engineering, AWS, and business intelligence — from pipeline design to dashboard reliability.
- Data Platform Engineering
- AWS (Glue, Athena, S3)
- Dagster & Airflow
- QuickSight & BI
- Cost & Performance Optimization
MEng in Chemical Engineering - Processes and Product, 2020
Faculty of Engineering of the University of Porto
BSc in Engineering Sciences - Chemical Engineering, 2018
Faculty of Engineering of the University of Porto
Experience

- Next-Gen Data Platform
Designed and delivered a Dagster + S3 + Glue + Athena analytics platform, replacing legacy RDS-backed reporting flows with 12+ automated data pipelines running on daily and hourly schedules.
- QuickSight Modernization
Migrated 25+ customer-facing QuickSight analyses and core datasets from RDS-backed custom SQL to Athena-backed sources, improving scalability, reliability, and reducing direct load on production replica databases.
- SPICE Performance & Reliability
Reduced P90 SPICE refresh duration from ~285 minutes to ~14 minutes (~95% improvement), while increasing refresh success rate from ~82% to 99%+.
More Trimble highlights
- Data Platform Observability
Building end-to-end observability from Dagster to QuickSight to track pipeline health, dataset usage, Athena query cost, SPICE consumption, storage footprint, stale assets, and top compute/storage offenders.
- Cost Optimization & Tech Debt Reduction
Driving a 30% monthly compute and storage cost reduction target by identifying high-cost queries, unused datasets, orphaned storage, inefficient refresh patterns, and legacy RDS dependencies.
- Self-Service Enablement
Creating a data platform knowledge base, data dictionary, runbooks, and formalized change processes to reduce knowledge silos and enable consultants and engineers to independently manage pipeline and dashboard changes.


Business Intelligence Engineer on the EU SC FC Launch team. Led the Network Planning Tech MBR across 25 projects, rolled out EXTREME to 20,000+ EU Central Flow users, built EU/NA Pod Transfer QuickSight dashboards, and reduced Redshift load by descheduling unused QuickSight datasets.
Show project details
EU Supply Chain Analytics FC Launch
The EU SC FC Launch Team manages the supply chain ramp up of new Amazon-owned FCs from zero to one. The team strives to support the overall S-Team goal of 10% YoY productivity improvement of new FCs by providing required IB and OB daily/weekly volumes to maximize new FC's operation effciency.
- EU SC Network Planning MBR Tech Lead
Led the EU SC Network Planning Tech MBR, coordinating 5 subteams across 25 tech projects. Collaborated closely with 5 tech members and 5 business stakeholders, orchestrating the successful delivery of solutions.
Details
<ul> <li>The Network Planning Tech Projects MBR serves as a bridge between technical advancements and business strategy, providing an accessible overview for all stakeholders. Weekly calls help align tech priorities across subteams and BIE resources.</li> <li>Project management is facilitated using <a href="https://app.asana.com/0/portfolio/1206552745859427/list">Asana</a>, ensuring tasks are well-structured, tracked, and completed on time. Subteams are assigned clear priorities and deadlines, and project progress is monitored to ensure alignment with strategic goals.</li> <li>Consult on the design, implementation, and delivery of BI solutions in complex problem spaces, delivering critical-path code and guiding teams on key trade-offs, ensuring that solutions are as simple and scalable as possible.</li> <li>Enable BIEs and interns to contribute meaningfully by promoting teamwork and showcasing their innovations, fostering a collaborative and innovative environment.</li> </ul> - Rolled out EXTREME: Excel to Redshift Migration Engine to EU Central Flow
Successfully implemented EXTREME for over 20,000 EU Central Flow users, streamlining the migration of Excel data to Redshift.
Details
<ul> <li>Utilizes an IAM role instead of a generic user for querying Redshift, enhancing security and access control.</li> <li>Averages around 10 daily service calls, demonstrating high usage and integration within existing workflows.</li> <li>Over 100 local tables created, significantly improving data accessibility and reporting capabilities for users.</li> <li>Based on user feedback, EXTREME has reduced the time required to manually update a local table via traditional SQL commands by more than half.</li> </ul> - Developed EU/NA Pod Transfer QuickSight Dashboard
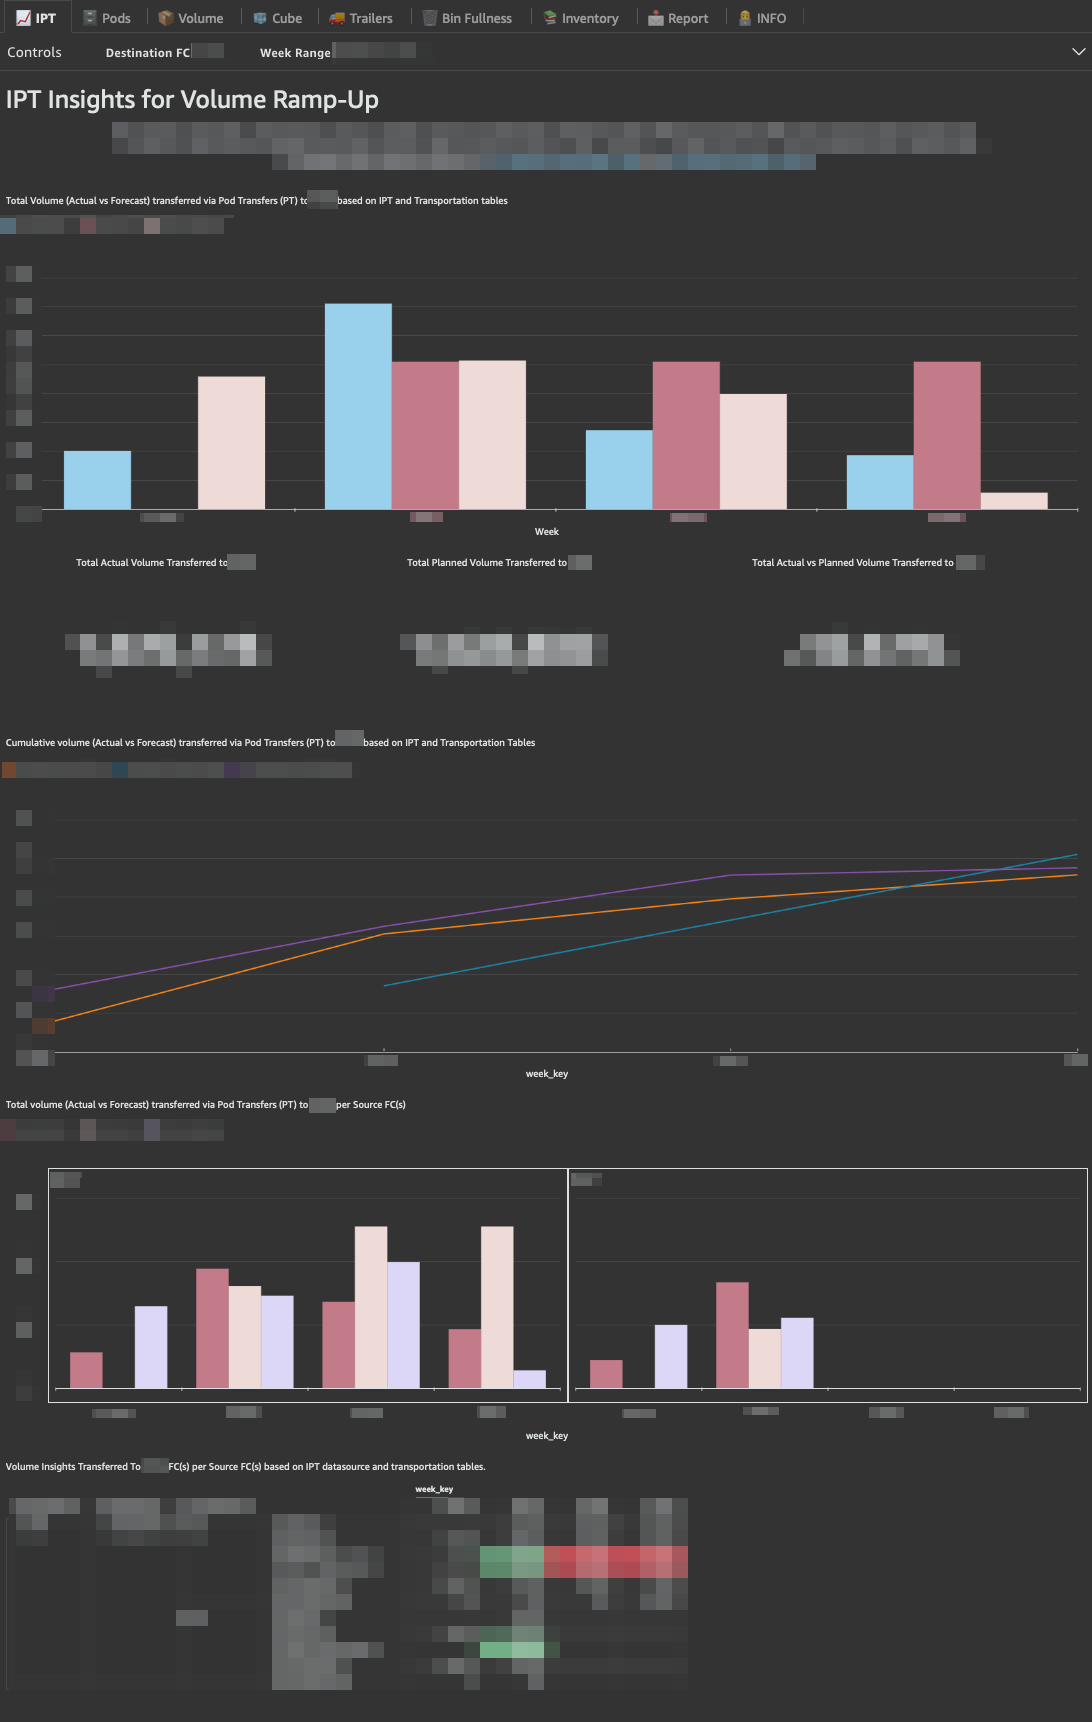
Launched two comprehensive dashboards to track pod transfers across EU and NA warehouses, leveraging 6 QuickSight datasets per region while denormalizing data from Amazon's central S3 datalake (Andes).
Details
- Data pipelines denormalized using Spark SQL, forming Redshift tables to ensure seamless data availability for key metrics and insights.
- Dashboard metrics cover pod transfer volumes, item quantities, warehouse fullness, and relative fullness, viewed over 600 times by 40 distinct users.
- Includes 8 tabs (📈 IPT, Pods, Volume, Cube, Trailers, Bin Fullness, Inventory, and Report), with filters for warehouse selection and date ranges and finally a tab dedicated to our team contact information and extract/ load job details (👨💻 INFO).
- QuickSight Dataset Optimization and Redshift Usage Reduction
Implemented a data-driven approach to identify and deschedule QuickSight datasets feeding unused or underutilized dashboards, improving Redshift query performance.
Details
<ul>
  <li>Developed a process using CloudTrail logs and Redshift query metrics to track dataset usage, linking datasets to active dashboards and analyses.</li>
  <li>Reduced operational overhead by targeting datasets feeding dashboards with zero or minimal user views, freeing up Redshift resources and improving overall query performance.</li>
  <li>Partnered with Python integration to automate analysis and reconciliation of datasets with Redshift queries, views, and deleted dashboard events.</li>
  <li>Identified 50+ datasets that ran unnecessary queries, consuming 6+ hours of Redshift processing time weekly.</li>
</ul>
Business Intelligence Engineer on EU SC Analytics, owning Redshift infrastructure for 300+ users across two AWS accounts. Built EXTREME (Excel-to-Redshift), CloudWatch observability, and cost automation tooling. On FC Launch, mentored BI interns, delivered the Pod Selection Algorithm, TSO capacity alerts, and the FC Launch Performance QuickSight dashboard.
Show project details
EU Supply Chain Analytics Data Engineering Admin
The EU SC Analytics Data Engineering Admin Team mission is to empower the users (+300 users) to produce and obtain data in the fastest, easiest and cheapest way, while maintaining and continuously improve the data infrastructure.
Ownership and management of 2 AWS accounts, including 2 Redshift clusters.
- EXTREME: Excel to Redshift Migration Engine
A Native AWS solution that automatically converts your .xlsx files into Redshift local tables seamlessly and quickly while additionally inferring the most frugal table definition based on the present data.
Details
<ul> <li>EXTREME is centered around a micro-service orchestration workflow using AWS Step Functions. It was designed for the best user-experience by only requiring minimal knowledge on basic tools and functionalities using Excel and Network Shared Folders. Drop your Excel file inside the appropriate sub folder, wait and get notified on the EXTREME Chime room once the table has been Created or Updated on EUSOPDW.</li> <img src="https://joaopereiradsantos.com/uploads/extreme_userdiag.png" alt="EXTREME User Architecture"> <img src="https://joaopereiradsantos.com/uploads/stepfunctions_graph.png" alt="EXTREME SF Diagram"> </ul> </details></p> - AWS EUSOPDW CloudWatch Dashboard
Leverage the power of CloudWatch metrics into EUSOPDW Redshift cluster to develop the EUSOPDW CloudWatch Dashboard. Using CloudWatch metrics for Amazon Redshift, we can get information about the cluster's health and performance up to the node level.
Details
<ul> <li>EUSOPDW CloudWatch Dashboard monitors the real time performance of EUSOPDW cluster across multiple metrics, e.g. the average query completion time, the number of queries running or the number of queries waiting.</li> <li>The EU SC Analytics BI Admin Team have also implemented 4 metric alarms in order to proactively act on cluster issues, e.g. high backlog or unusual CPU utilization.</li> <li>The Dashboard is divided into 3 main section: 1 – Overview: Focus on 3 main metrics (WLMQueryDuration, WLMRunningQueries and WLMQueueLength) on the 3 main WLM Queues (admin, allusers and planners); 2 – Performance: Focus mainly on CPU utilization per node, network and I/O rates, open DB connections and query stage share; 3 – WLM Performance and Latency Performance: Similar to the Overview section but with more metric details and all the existing WLM Queues and latency granularity (short, medium and long).</li> <img src="https://joaopereiradsantos.com/uploads/rs_cloudwatch_1.png" alt="Redshift CloudWatch 1"> <img src="https://joaopereiradsantos.com/uploads/rs_cloudwatch_2.png" alt="Redshift CloudWatch 2"> </ul> </details></p> - AWS Auto Tag
“Tag Early, Tag, Often”. Automatically tagging resources greatly improves the ease of cost allocation and governance by the BI Admin Team. It is a challenge to get users to remember to and correctly label every AWS resource. Fundamentally they shouldn’t have to.
Details
Public Documentation- As soon as a user creates a resource supported by AutoTag (such as EC2 instances, IAM users, IAM roles, RDS instances, S3 buckets, EMR clusters, VPCs, etc), AutoTag will automatically apply up to 3 new tags: C (Resource Owner) + T (Resource Creation Datetime) + I (Resource Invoked by what other resource).
- AWS Auto Scheduler
Reduces operational costs by stopping resources that are not in use and starts resources when their capacity is needed. This solution can result in up to 70% cost savings on those instances that are only necessary during regular business hours (weekly utilization reduced from 168 hours to 50 hours).
Details
Public Documentation- Simply tag the key as “AutoSchedule” and associate the respective scheduler value (i.e. Key = “AutoSchedule”; Value = “1130-only-stop”);
- Schedule configurations are set using the AutoScheduler-ConfigTable on DynamoDB. A user can create a period (i.e. office-hours: starts at 09:00, ends at 17:00 during week days) and then create a schedule based on a single or multiple periods (i.e. using the previous office-hours period but adding the timezone: Europe/London);
- Configuration setup also allows for vertical scaling: scale up or down based on the instance requirements (i.e. scale up an instance to t2.micro during weekends and scale down to t2.nano during the week).
- AWS Sagemaker Auto Stop
Sagemaker is the second largest cost in our AWS accounts. This solution auto-shutdown both SageMaker Notebook and SageMaker Studio instances when they are idle for 1 hour.
Details
Public Documentation- A lifecycle configuration provides shell scripts that run either when a notebook instance is created or whenever it starts. The deployed lifecycle config will run the autostop.py module every 5 minutes on the backend;
- It will be making API calls to the Jupyter server and checking the kernel status for ‘idle’. ‘Idleness’ as defined by Jupyter team, means that no code is running (other activities such as opening a new notebook will also reset the idle timer).
EU Supply Chain Analytics FC Launch
The EU SC FC Launch Team manages the supply chain ramp up of new Amazon-owned FCs from zero to one. The team strives to support the overall S-Team goal of 10% YoY productivity improvement of new FCs by providing required IB and OB daily/weekly volumes to maximize new FC's operation effciency.
- Tech Project Manager & Mentor
Manage a team of 5+ BI interns by applying Agile project management methodologies (Scrum & Kanban) on Asana. Enforce software development good practices (git for version control, pyenv for Python version management and poetry for Python packaging and dependency management).
Details
Internal Documentation- Setup documentation and provide support for new tech users ramp-up;
- Mentor and enpower BI interns for a successful career and experience;
- Manage technical projects on Asana based on Project Managers (PM) requirements. Break down the problem statement, set-up tasks and assign relative priorities, due dates and estimated completion times. Code review the merge requests (MR), main branch merging and production deployment (CI/CD);
- Impose a standardised code-style, formatter and linter (XML for SQL and black and flake8 for IDE). Use of snake_case for functions and variables and PascalCase for classes. Use of Google Style for docstrings. TOML for configuration files to be read by humans, JSON for machines;
- Enforce data pipelines documentation and Pyramid (internal tool as a scalable way of tracking the status and tracing upstream pipelines) enabled alerts for proactive monitoring and management of production-ready team pipelines.
- Pod Selection Algorithm
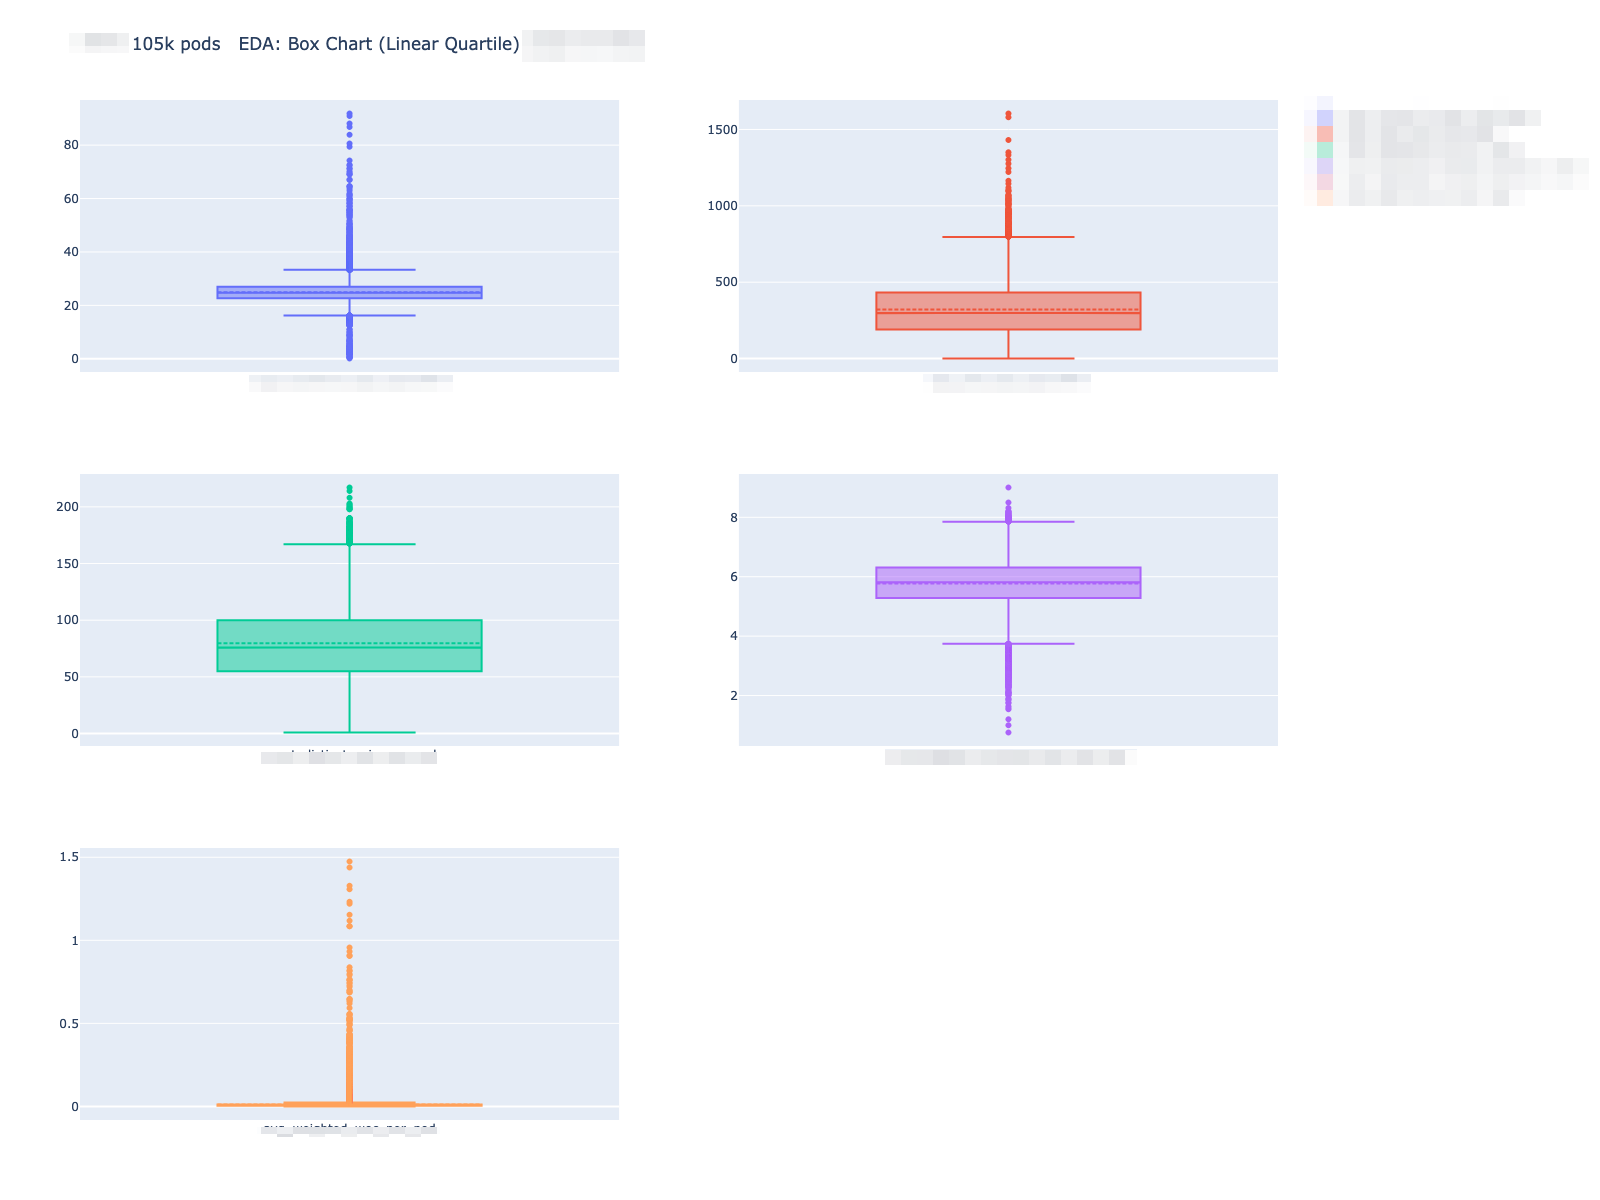
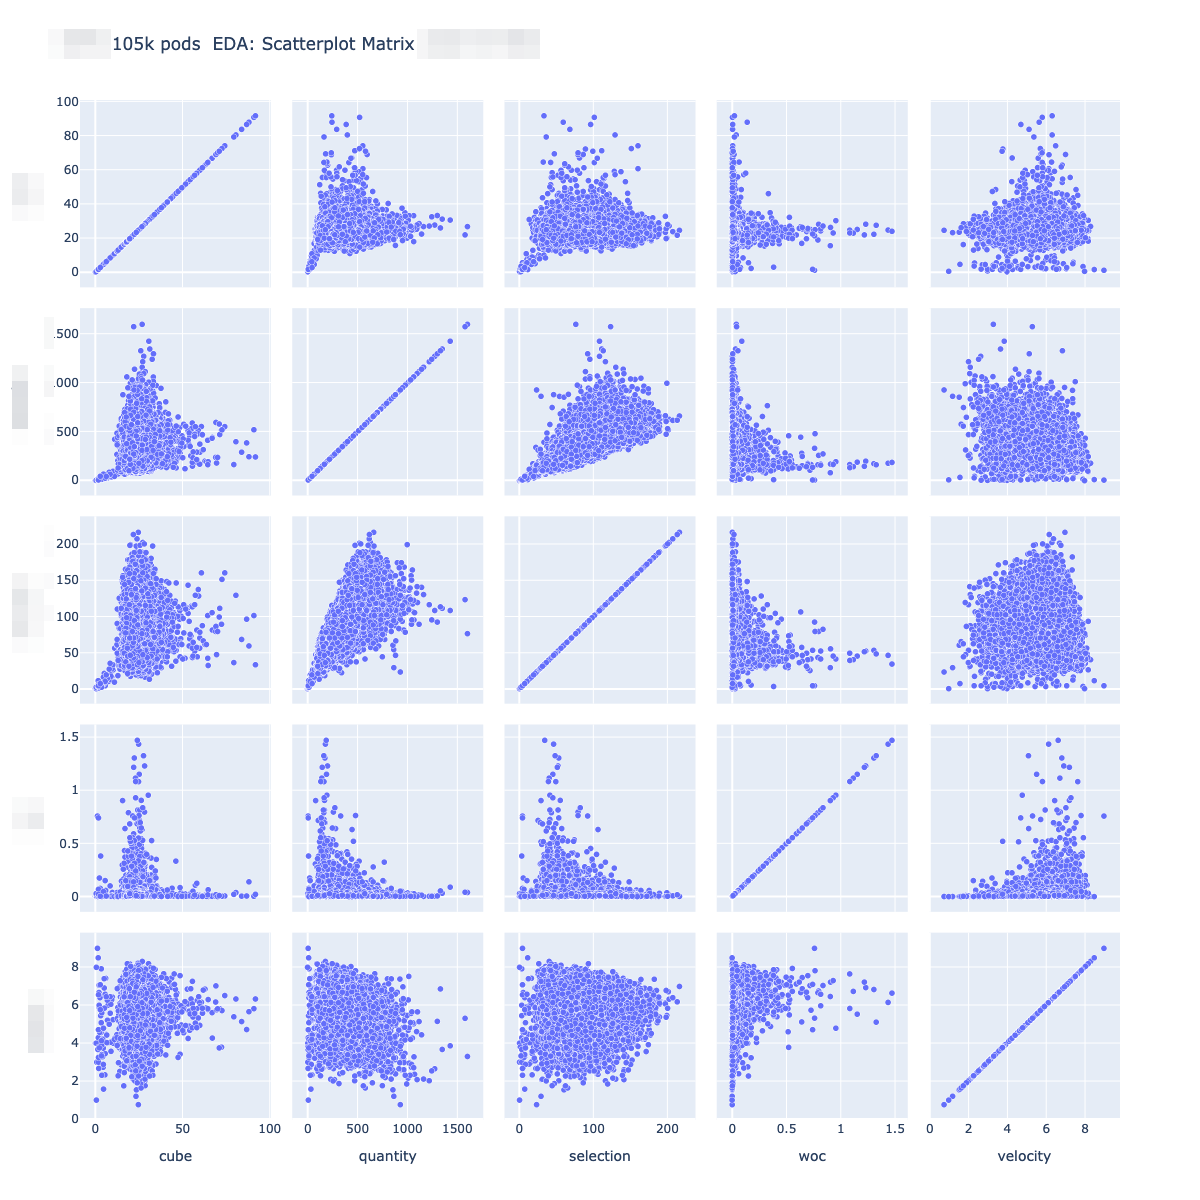
Output a list of pods to transfer based on a set of inputs, business criteria (objective functions) and hard operational constrains. The objective functions currently set are: Cube (SUM volume [ft2] of each unit in a pod); Uniqueness (Count of distinct ASINs in a pod that are unique relative to their presence within their respective marketplace); Quantity (SUM units in a pod).
Details
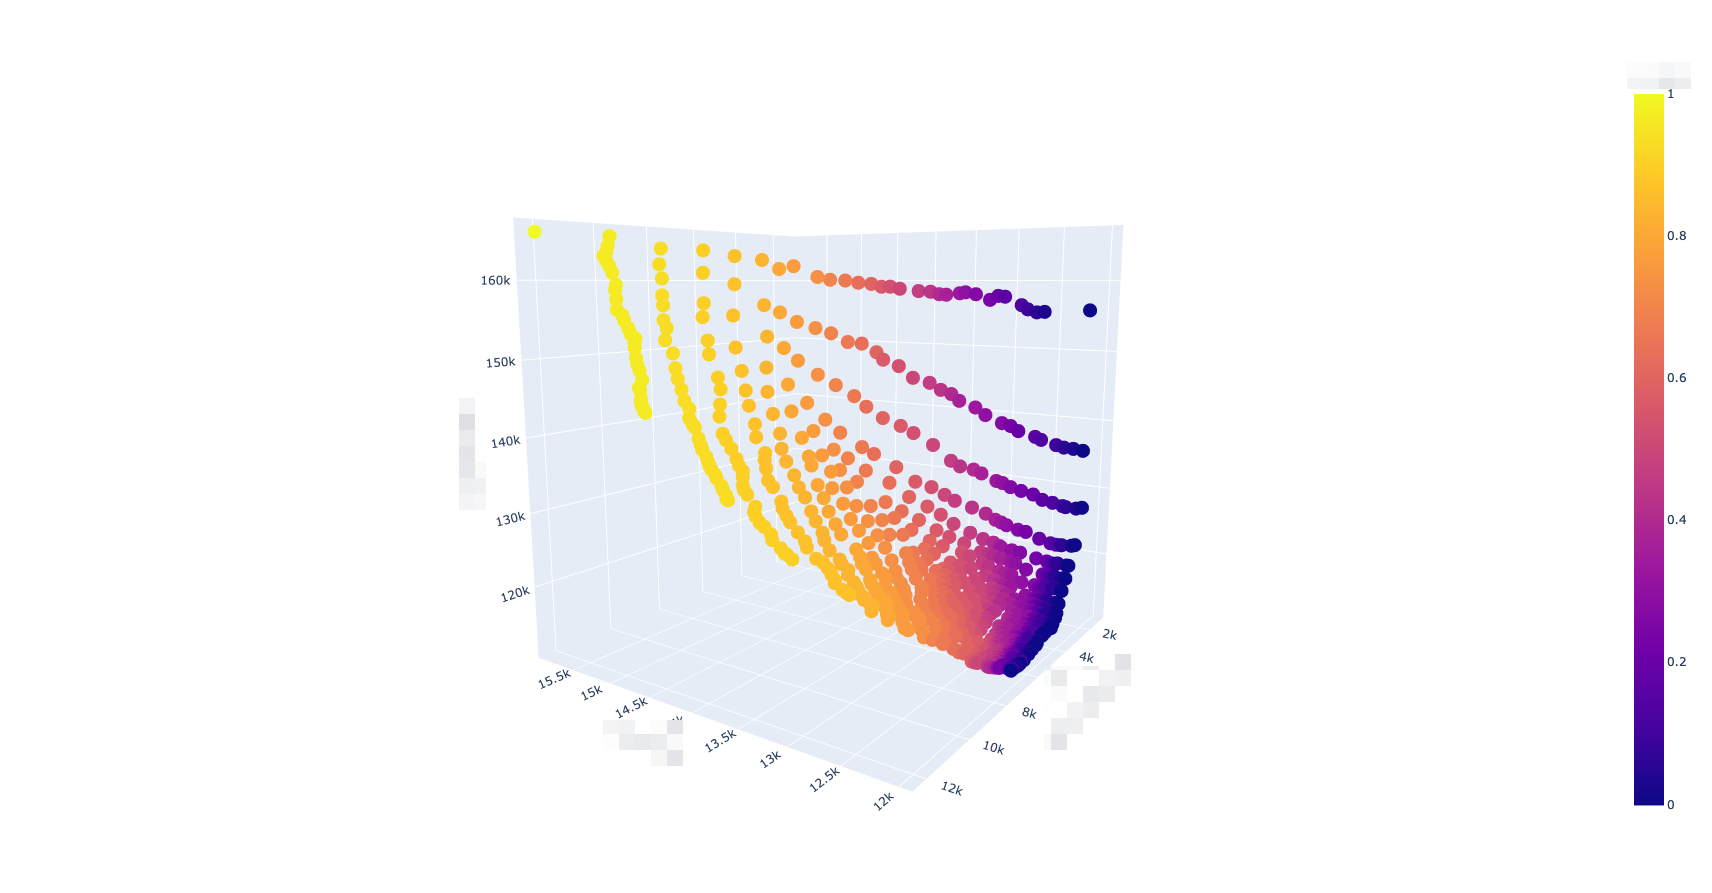
- The core modeling started as a Nested Sorting optimization but migrated to a Integer Linear Programming (ILP) optimization using the FICO Xpress Solver. While the core mathematical concepts remain, as opposed to achieve a single optimal output, PSA uses a weights tunning approach for every new set of inputs simulating 1k+ data points for different weight and objective function combinations;
- While the previous production model (SPOCK) produced an overall weekly weighted average of 33 cube per pod (CPP), PSA generated 36 CPP (~10% improvement). Fullness of all pods transferred is on average 105% instead of 90%. Similarly, the actual weekly weighted average units per pod (UPP) was 550 while PSA’s UPP equaled 420 (~15% decrease), which reduces OB NWA because of less inventory units. PSA really stands out when it comes to unique inventory: SPOCK logic transferred 140k unique units, totaling 7% with respect to the total transferred units, while PSA transferred 45k, 2% versus the total transferred units (500bps reduction).
- Pre-Launch TSO Max Capacity Alert & Automated CPT Closure
Automated control on pre-launch TSO assigments for new FC launches. Gets live TSO from RODEO, updates a Chime room based on the predefined FC processing capacity threshold for a given source FC, destination FC and CPT and applies a RTCT Closure once 95% TSO capacity is breached.
Details
<ul> <li>Pre-launch TSO is only available for unique inventory stranded in the new FC while outbound systems are still not live. It allows for a better customer promise but is highly risky as it directly impacts customer experience if the FC processing capacity vs TSO assignments per CPT is inadequate;</li> <li>There are 4 notification bins per CPT: 75-85%, 85-95%, 95-100% and +100%. The automated capping will trigger at +95%. In order to avoid triggering at every run, a log file is updated only triggering the alert once per bin;</li> <li>The script interacts with internal supply chain systems APIs to retrieve current arc assignments ready to be picked and arc scheduling and configurations in order to cap the CPT. Deployed on a EC2/ Amazon Linux 2 CloudDevDesktop and scheduled using cron (*/5 * * * *).</li> </ul> </details></p> - EU SC FC Launch Performance QuickSight Dashboard
The EU SC FC Launch Performance Dashboard is a “One Stop Shop” metrics compilation to provide a user friendly interface and visualizations of new FC’s ramp up actuals vs. wk-1/locked S&OP plans.
Details
<ul> <li>It aims to not only support Launch PM with easy data access during pre/post launch period, but also facilitate post-mortem analysis such as comparing ramp up performance of FCs launched in different years;</li> <li>For each FC and Week combination there’re a different number of possible Flows and Subflows. For instance, as the main flow: Crossdock Transfer In, Inventory, Manual Transfer In, New Vendor Freight, New Workable Demand, Not Yet Received (FC Receive Correction), Orders Cancelled/ Confirmed/ Received/ Submitted, Pod Transfer In, Proactive Transfer In, Reactive Transfer In all have a respective subflow related to the total number of units drilled down by: Total Quantity, Quantity FBA and Quantity AMZN (Total Quantity = FBA + AMZN);</li> <li>The dashboard has 7 main metric tabs (📈 TIB, NTSI, NVF, POD, INV, NWD and ORD), a summary report tab (📝 RPT), an FC comparison tab (🆚 VS) and finally a tab dedicated to our team contact information and extract/ load job details (👨💻 INFO).</li> <div style="display: flex;"> <img src="https://joaopereiradsantos.com/uploads/qs_fcperformance_tib.png" alt="EU SC FC Performance QS TIB" style="width: 49%; margin-right: 1%;"> <img src="https://joaopereiradsantos.com/uploads/qs_fcperformance_rpt.png" alt="EU SC FC Performance QS RPT" style="width: 49%;"> </div> </ul> </details></p>
Business Intelligence intern on EU IXD supply chain analytics. Developed Spread Bias and placement metrics, built forecasting and operations dashboards in QuickSight and Power BI, and delivered analyses on tote utilization, fluid loading, and item selection.
Show project details
- Why Spread is Biased & How to Overcome it: Spread Bias
Development of a new metric: Spread Bias. A complementary metric to FC Spread (how many FCs on average an ASIN is sent to).
Details
<ul> <li>Mathematically, it’s a weekly weighted average share of total volume cross-docked at each FC per ASIN. The more biased the volume is towards one particular FC, the more the spread bias will tend to 1. Reciprocally, the more evenly and the more FCs the volume is spread to, spread bias will tend towards 0;</li> <li>Spread Bias is [] x more correlated to deviations in Case Break than in FC Spread. Less Spread Bias leads to a more uniform FC level placement which, in turn, increases unique inventory and reduces the risk of TRB (constraint in outbound capacity);</li> <li>Semi-Automated Jupyter Notebook Code & Markdown paper with interactive .html python code preview and Plotly graphs, Placement Impact bridge with Pearson Correlation Analysis and SQL script for production use.</li> </ul> </details></p> - ITS 2% Rule & Impact on Placement
Understanding of hard constrains in optimization models (SCOT heuristic approach to reduce latency of the request easing the algorithm decision time by removing the possibility of case break) and impact on placement and financial outcomes (spread, item selection, period 1/ period 2 AR share and misplacement volume).
Details
<ul> <li>Expected a yearly decrease of 4MM units in total cross-border fulfillment (CBF) by reduction in misplaced volume, 3x more item selection leading to higher LIS, higher inventory turns and 2x less Spread Bias;</li> <li>Semi-Automated Jupyter Notebook Code & Markdown paper with interactive .html python code preview and interactive Plotly graphs.</li> </ul> </details></p> - Tote Utilization Dashboard
Tote Utilization dashboard and monitoring for the IXD Sr. Ops Managers & Area Managers. Aimed at knowledge sharing and improved users tote filling best practices in order to increase truck fill rate and tote optimization.
Details
<ul> <li>Expected an increase of 2% in the weekly average tote utilization by IXD, leading to a yearly reduction of [] MM totes, 1k trucks, 800 tonnes of CO<sub>2</sub> emissions and $ 1MM in overall savings;</li> <li>Data Pipeline between 2 AWS RedShift Clusters, Daily Maintenance of 6 Tables with SQL ETL Manager and AWS QuickSight.</li> </ul> </details></p> - Arc Bin Level Forecast
Improved accuracy on the arc bin level forecast with univariate multi forecasting time series using Exponential Moving Average (EMA), Auto-ARIMA and FBProphet models.
Details
<ul> <li>QuickSight analysis and Dashboard for the preceding weekly arc bin volume and share;</li> <li>5% increase in forecast accuracy leading to an expected optimization in bin level planning for bin fullness balance and IXD bin offsets;</li> <li>AWS SageMaker with Python: Pandas, Matplotlib, NumPy, Pmdarima and FBProphet, AWS RedShift and AWS QuickSight.</li> </ul> </details></p> - Centralized Fluid Loading Dashboard
Centralized Fluid Loading (FL) Dashboard for the overall Productivity (fluid loading share, volume, fill rate and labor) Sustainability (saved number of trucks, CO2 emissions, plastic waste) and Savings (transportation, productivity gain, unloading cost) metrics.
Details
<ul> <li>EU IXD Fluid Loading is 100% more productive than normal pallet building and loading, loads 100% more items and reduces 50% of the trucks hence saving 13.5k tonnes of CO2 emissions;</li> <li>SQL Scheduled Extract Jobs and Microsoft Power BI: Waffle chart, Sankey diagram & Radar chart.</li> </ul> </details></p> - Sort Share and Impact on Item Selection
Deep dive analysis regarding the impact on the unique item selection based on the IXD sort share deviation to ideals. Financial outcome based on the country level Cross-Border Fulfillment (CBF) cost on different ITS algorithm decisions.
Details
<ul>
  <li>Improved sort share bridge to item selection and weekly WBR review in sort share deviation to ideals, right sortation and CBF due to wrong sortation;</li>
  <li>SQL Extract Jobs and Statistical Analysis with Excel: Pearson Correlation Coefficient, P-Value and Linear Regression.</li>
</ul>
</details></p>

- Requests Management Workflow Automation & Optimization
Aimed at improving request scheduling efficiency by over 48% YoY.
Details
- Applied DMAIC methodology (Define, Measure, Analyze, Improve, and Control) as a data-driven improvement cycle;
- Implemented and tracked KPIs with Python: Pandas, Statsmodels, Seaborn, and Plotly;
- Semi-automated a relative job prioritization system with Excel Power Query and VBA;
- Built a dashboard prototype with Python Dash and drove adoption with a macro-enabled workbook.
- Qualitative and Quantitative Statistical Analysis in Copper Electroplating Baths
Eased decision-making for chemical component control and total organic contamination (TOC) monitoring.
Details
- Applied linear regression and correlation models (Pearson and Spearman) with R, Minitab, and Excel;
- Implemented and tracked KPIs with Python: Pandas, Statsmodels, Seaborn, and Plotly;
- Built ETL workflows into Microsoft Power BI for manufacturing dataset analysis.
Projects
Applied automation and quantitative experiments outside the day job.


Certifications
Selected credentials — see LinkedIn for the full list.

Show details
Intended for individuals who have the knowledge and skills necessary to effectively demonstrate an overall understanding of the AWS Cloud. Abilities Validated by the Certification: Define what the AWS Cloud is and the basic global infrastructure; Describe basic AWS Cloud architectural principles; Describe the AWS Cloud value proposition; Describe key services on the AWS platform and their common use cases (for example, compute and analytics); Describe basic security and compliance aspects of the AWS platform and the shared security model; Define the billing, account management, and pricing models; Identify sources of documentation or technical assistance (for example, whitepapers or support tickets); Describe basic/core characteristics of deploying and operating in the AWS Cloud. (Exam Score: 89.3%)

Show details
Follows the curriculum for Microsoft certification exam 70-461: Querying Microsoft SQL Server 2012/2014. Create Database Objects: Create and alter tables using T-SQL syntax, Create and alter views, Design views, Create and modify constraints, Create and alter DML triggers; Work With Data: Query data by using SELECT statements, Implement sub-queries, Implement data types, Implement aggregate queries, Query and manage XML data; Modify Data: Create and alter stored procedures, Modify data by using INSERT, UPDATE, and DELETE statements, Combine datasets, Work with functions; Troubleshoot And Optimize: Optimize queries, Manage transactions, Evaluate the use of row-based operations vs. set-based operations, Implement error handling. (45 Total Hours)

Show details
Learn about Plotly to create plots like Bar Charts, Line Charts, Scatter Plots, Heat Maps, etc; Create Layouts with Plotly's Dash library; Use Dash to create interactive components with Plotly; Learn how to connect multiple inputs and outputs with a dashboard; Update live interactive graphs with clicks, hover overs, and more; Connect the interactive dashboard to live updating data for streaming information; Learn how to secure your interactive dashboards with App Authorization; Deploy your interactive dashboards to the internet with services like Heroku. (9.5 Total Hours) Jose Portilla, Pierian Data Inc.

Show details
Data Engineer Trainning: Technically connect and maintain Celonis processes; Analyst Trainning: Translate data into actionable business insights. Create target oriented analyses to transform your business; Business User Trainning: Simplify your daily work. Get intelligent recommendations to execute the right actions. (30 Total Hours)
Show details
Understanding of the Data Science field and the type of analysis carried out; Learn how to pre-process data; Understand the mathematics behind Machine Learning; Coding in Python and learn how to use it for statistical analysis; Perform linear and logistic regressions in Python; Carry out cluster and factor analysis; Create Machine Learning algorithms in Python, using NumPy, statsmodels and scikit-learn; Use state-of-the-art Deep Learning frameworks such as Google's TensorFlow; Unfold the power of deep neural networks; Improve Machine Learning algorithms by studying underfitting, overfitting, training, validation, n-fold cross validation, testing, and how hyperparameters could improve performance; Apply your skills to real-life business cases. (29 Total Hours)